
Special Issue
Brazil Stock Guide – Over the first 25 years of the 21st century, Brazil has changed profoundly — not only in politics or consumption patterns, but in the machinery that sustains its economy. The companies that dominated the country in the early 2000s are, for the most part, no longer the same ones that today generate the highest revenues. Some disappeared. Others were absorbed. New sectors rose to the center of gravity.
In this special report, Brazil Stock Guide examines that transformation through a simple yet revealing indicator: the ranking of the country’s largest companies. The analysis is built on annual surveys and open databases, drawing on information disclosed in corporate financial statements and audited accounts. Financial groups, including banks and other financial institutions, are not included in this ranking, which focuses exclusively on non-financial corporations.
Across three articles, published on alternating days, the series shows how Brazil became more dependent on commodities, energy and agribusiness, reduced the relative weight of manufacturing, concentrated capital, and reshaped the map of the brands that dominate its economy. More than a list of winners and losers, the ranking acts as a mirror of economic choices, comparative advantages and structural constraints that have defined Brazil in the first quarter of the 21st century.
When factories left the center
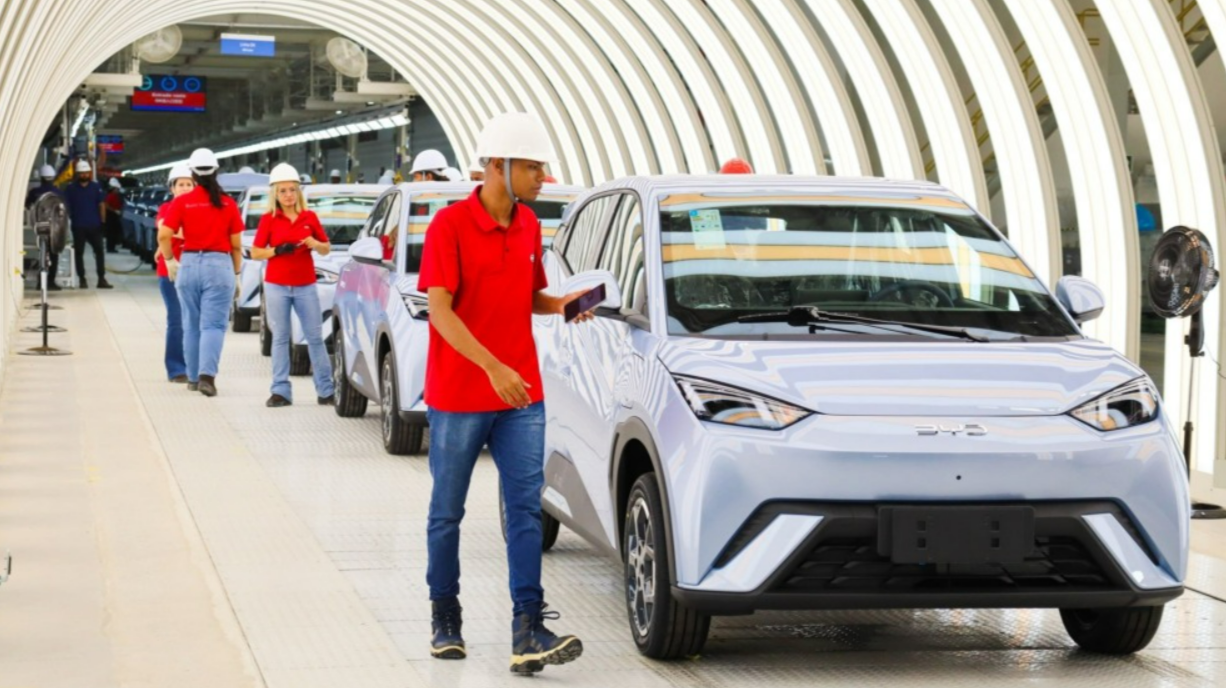
In 2000, car manufacturing in Brazil was a symbol of economic progress. Automakers ranked among the country’s largest companies, employed tens of thousands of workers, and embodied Brazil’s industrial integration into global markets. Twenty-five years later, they have largely disappeared from the top of the rankings — replaced by companies that extract, transport and trade oil, grains and minerals.
A comparison between the rankings of Brazil’s largest companies in 2000 and in 2025, compiled by Brazil Stock Guide using public data and corporate financial statements, points to a structural shift: the re-primarization of the Brazilian economy, marked by a renewed dependence on commodities, energy and natural-resource-based value chains.
In the early 2000s, the corporate elite reflected a more industrialized and urban Brazil. Automakers, durable goods manufacturers, telecommunications firms and traditional retailers occupied central positions.
The automotive industry—particularly companies such as Volkswagen, General Motors and Fiat—acted as a catalyst for investment, employment and tax revenues, supported by factories spread across multiple states and a dense supplier network.
By 2025, the picture is markedly different. The rankings are dominated by companies linked to oil and fuels, mining, agribusiness and animal protein. Petrobras remains the undisputed leader, now anchored in large-scale crude oil production. Over the past decade, however, the company has divested downstream and adjacent assets, including stakes in refining capacity, fuel distribution networks and petrochemicals.
As a result, Brazil’s pre-salt offshore fields have become Petrobras’ central growth engine. These ultra-deepwater reserves now concentrate the company’s capital allocation, technological edge and strategic focus, reinforcing a business model increasingly centered on exploration and production rather than on a fully integrated oil major spanning the entire value chain.
Around it, fuel distributors, agricultural trading houses, meat processors and mining companies move massive physical volumes, capable of generating billions in revenue even with compressed margins. In 2025, companies linked to fuels, grains, fertilizers, proteins and iron ore dominate the upper tiers of Brazil’s corporate hierarchy, reflecting scale-driven business models that prioritize throughput and logistics efficiency over value added per unit.
Growth is now explained less by the manufacture of industrial goods and more by the ability to extract, process and move large quantities of commodities through extended logistics chains. Oil, iron ore, soybeans, corn, pulp and animal protein account for most incremental corporate revenues. These sectors generate export proceeds denominated in hard currency and remain highly sensitive to global price cycles, freight costs and exchange-rate fluctuations.
Trade data reinforce the shift. Manufactured goods represented more than half of Brazilian exports at the turn of the century; by the mid-2020s, commodities and semi-processed products account for roughly two-thirds of total export value. Iron ore, crude oil, soybeans, meat and pulp dominate shipment volumes, while higher-value manufactured exports remain confined to a narrow set of segments. Export growth has thus become increasingly volume-driven, rather than rooted in industrial complexity or technological upgrading.
International comparisons further underscore Brazil’s divergence. Mexico preserved a manufacturing-led integration model with the United States, sustaining industrial employment and scale, with manufactured goods representing the overwhelming majority of exports. South Korea followed a different trajectory, doubling down on capital-intensive manufacturing, advanced technology and global brands, trading labor intensity for productivity and value added. Even Indonesia, another commodity-rich economy, combined resource extraction with downstream processing to preserve industrial depth.
Brazil moved in the opposite direction. Industrial employment fell from roughly one in five formal jobs in the early 2000s to close to one in ten by the mid-2020s. In absolute terms, manufacturing payrolls stagnated, while agribusiness, mining, logistics and energy absorbed capital with far lower labor intensity. The structure of job creation shifted decisively away from factories.
Investment patterns followed the same logic. Over the past decade, an increasing share of corporate capital expenditure flowed into offshore oil, ports, pipelines, railways and grain corridors. Energy and commodity groups concentrated investment on extraction, transport and processing capacity. By contrast, non-resource manufacturing investment failed to recover to pre-2014 levels, remaining largely defensive and focused on maintenance rather than expansion.
The retreat of automakers in corporate rankings encapsulates the broader trend. Production became more concentrated, several plants were closed or downsized, and strategic decisions migrated to global headquarters. Local supplier networks thinned, employment multipliers weakened, and Brazil’s role shifted toward serving the domestic market rather than acting as an export-oriented manufacturing hub.
The macro outcome is a Brazil more exposed to global trade, yet structurally less industrialized. The country expanded its relevance as a supplier of energy, food and minerals, particularly to Asian markets, but at the cost of reducing manufacturing’s share in employment, investment and corporate leadership. The corporate elite reflects this choice: fewer factories, more terminals; less fabrication, more extraction — and a growth model increasingly tied to commodity cycles rather than sustained gains in industrial complexity.
Here are the rankings comparing Brazil’s 25 largest companies in 2000 and 2025.

Comparison: 2000 vs 2025 – Net Revenue (R$ billions)
| Rank | 2000 – Company | Revenue 2000 | Sector (2000) | 2025 – Company | Revenue 2025 | Sector (2025) |
| 1 | Petrobras | 49.1 | Oil & Gas | Petrobras | 490.8 | Oil & Gas |
| 2 | Petrobras Distribuidoraᵃ | 16.1 | Oil Derivatives | JBS | 417.0 | Food & Protein |
| 3 | Volkswagen | 10.2 | Vehicles & Parts | Raízen | 255.2 | Oil & Gas |
| 4 | Furnas | 9.3 | Electric Power | Vale | 200.0 | Mining |
| 5 | Telefônica SP | 9.0 | Telecom | Vibraᵃ | 172.3 | Oil Derivatives |
| 6 | Ipirangaᵇ | 8.9 | Oil Derivatives | Cosan | 169.3 | Oil & Gas |
| 7 | Shell | 8.9 | Oil Derivatives | Marfrig | 148.9 | Food & Protein |
| 8 | Telemarᶜ | 8.5 | Telecom | Ultraparᵇᵍ | 133.5 | Oil Derivatives |
| 9 | Embratelᵈ | 7.3 | Telecom | Grupo Carrefour Brasil | 115.6 | Retail |
| 10 | Pão de Açúcarᵉ | 7.2 | Retail | Cargill | 109.2 | Agribusiness |
| 11 | Carrefour | 7.1 | Retail | Ambev | 89.5 | Food & Beverages |
| 12 | General Motors | 7.0 | Vehicles & Parts | Stellantisᶠ | 79.2 | Vehicles & Parts |
| 13 | Embraer | 6.7 | Vehicles & Parts | Braskem | 77.4 | Oil & Gas |
| 14 | Fiat Automóveisᶠ | 6.4 | Vehicles & Parts | Assaí Atacadistaᵉ | 73.8 | Retail |
| 15 | CVRD (Vale) | 6.4 | Mining | Bunge Alimentos | 69.8 | Agribusiness |
| 16 | Texacoᵍ | 6.2 | Oil Derivatives | Gerdau | 67.0 | Metals & Steel |
| 17 | Brasil Telecomʰ | 6.2 | Telecom | ArcelorMittal Brasil | 66.6 | Metals & Steel |
| 18 | Eletropaulo Metropolitanaᶦ | 5.9 | Electric Power | Copersucar | 62.3 | Bioenergy |
| 19 | Itaipu Binacional | 5.8 | Electric Power | Mercado Livre | 61.5 | Retail |
| 20 | Bunge Alimentos | 5.4 | Food | BRF | 61.4 | Food & Protein |
| 21 | Varigʲ | 5.3 | Air Transport | Telefônica Brasil | 55.8 | Telecom |
| 22 | Essoᵏ | 5.2 | Oil Derivatives | Shell Brasil | 55.0 | Oil & Gas |
| 23 | Correios | 4.5 | Services | COFCO International | 53.3 | Agribusiness |
| 24 | Cemig | 4.5 | Electric Power | Rede D’Or | 50.6 | Healthcare Services |
| 25 | Cargill | 4.2 | Food | Neoenergia | 49.0 | Electric Power |
Notes – consolidation and corporate transformations (2000–2025)
- Petrobras Distribuidora was privatized and rebranded as Vibra.
b) Ipiranga was acquired and incorporated by Ultrapar.
c) Telemar’s assets were consolidated into Oi.
d) Embratel was privatized and later acquired by Claro.
e) GPA (Grupo Pão de Açúcar) completed a spin-off, creating Assaí Atacadista as a standalone company.
f) Fiat Automobiles became part of Stellantis following the FCA–PSA merger.
g) Texaco’s assets were incorporated by Ultrapar.
h) Brasil Telecom’s assets were incorporated into Oi.
i) Eletropaulo’s assets were acquired by Enel São Paulo (Enel-SP).
j) Varig filed for bankruptcy and ceased operations.
k) Esso sold its Brazilian assets to Raízen.
Sources: Audited company financial statements and disclosures, CVM regulatory filings, historical nominal company-reported financial series.


Leave a Reply